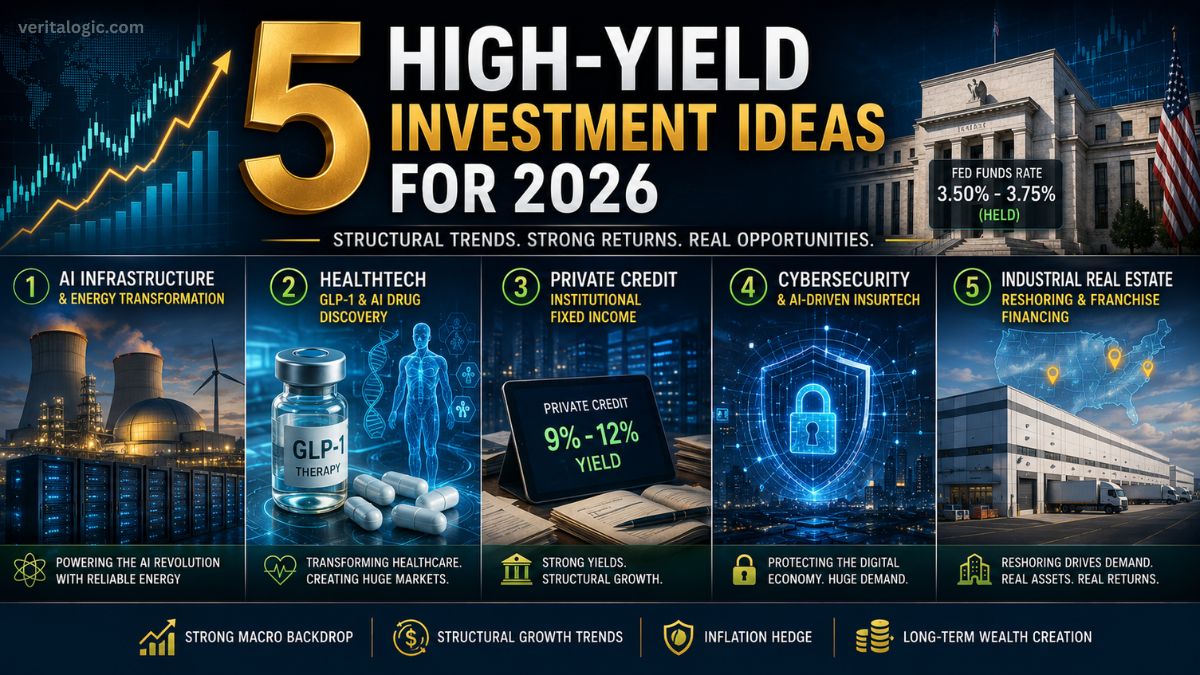
When the Fed Freezes, Structure Becomes Strategy
Kevin Warsh took the chair at the Federal Reserve this week and promptly did what his predecessor’s data left him no choice but to do. Rates stayed at 3.50%–3.75%. Core PCE, revised upward to 2.7% from December’s 2.5% projection, gave him no cover to cut. The labor market gave him no reason to hold urgently. He held.
That’s now two consecutive meetings without movement. Fed futures are pricing roughly 4.0% by late 2026. The 60/40 portfolio is still producing returns – just not the kind of returns that justify the risk of sitting still while five structural dislocations widen in plain sight.
The best high-yield investment ideas for 2026 are not macro bets on rate timing. They don’t require the Fed to do anything specific before year-end. Each of the five sectors below is being driven by a structural force -energy grid constraint, demographic-scale drug adoption, bank retreat from lending, rising enterprise cyber risk, and reshoring capital commitment – that persists regardless of whether Warsh cuts in September or holds until 2027.
What follows is not a thematic ETF shopping list. It is a capital allocation framework built on verified data from Federal Reserve projections, Moody’s research, CBRE market analysis, J.P. Morgan estimates, and industry sources through June 2026. Where the thesis can break, that’s described too.
June 2026 Macro Snapshot
| Indicator | Current Reading | Investment Context |
|---|---|---|
| Fed Funds Rate | 3.50%–3.75% | Held for 2nd consecutive meeting under new Chair Warsh |
| Core PCE Inflation | 2.7% | Revised up from 2.5%; no near-term cover for cuts |
| 2026 GDP Forecast | 2.4% | Federal Reserve March SEP estimate |
| Market-Implied Rate Path | ~4.0% by late 2026 | CME FedWatch futures pricing |
| Middle East Risk Premium | Elevated | Energy markets repricing geopolitical disruption |
| AI Grid Demand | Accelerating | Primary driver of structural energy market pressure |
Sources: Federal Reserve FOMC March 2026 Summary of Economic Projections; CME FedWatch; IEA Global Energy Outlook 2026
Sector 1: AI Infrastructure and the Energy Grid Problem

AI is no longer just a software story. U.S. data center electricity demand may surge from 176 TWh to 580 TWh by 2028, driving a structural energy crisis and a genuine nuclear renaissance. Sources: IEA; Brookings Institution, April 2026.
The AI investment story shifted in 2026. The software and model provider trade played out largely in 2023 and 2024. What’s moving now is harder to see and harder to build: the physical infrastructure required to keep the models running.
U.S. data center electricity demand is projected to reach as high as 580 terawatt hours by 2028, up from 176 TWh today, according to IEA data cited by the Brookings Institution. The IEA’s global base case puts total data center consumption at 945 TWh by 2030. These are not incremental numbers – they represent a structural shock to an energy grid that was not designed to absorb AI-driven demand growing at this pace, running at this consistency, without the cyclical variation that grid operators have spent decades planning around.
The practical consequence is a nuclear industry with real commercial momentum for the first time in a generation. More than 40 countries are actively expanding nuclear strategies. Uranium hit $100 per pound in January 2026 – the first time in two years – before settling near $86, still historically elevated relative to the prior decade. Westinghouse Electric, 49% owned by Cameco, is part of an $80 billion U.S. government agreement to build reactors specifically designated to service AI deployment. NuScale Power, holder of the only NRC-certified small modular reactor design, saw shares jump 7% after announcing upbeat deployment progress in May 2026.
The investment implication is not simply “buy nuclear.” It is more specific than that. Uranium producers and royalty structures – Cameco (CCJ) and Sprott Physical Uranium Trust – sit at a genuine supply deficit where annual reactor demand already exceeds mine production at current capacity. Data center REITs, specifically Equinix and Digital Realty, provide long-term lease cash flow structured to grow with the same AI buildout driving power demand. Liquid immersion cooling technology, which reduces energy intensity per rack by 30–40%, has moved from engineering curiosity to operational requirement for every major hyperscaler.
The constraint that investors most consistently underestimate: grid interconnection approvals. In multiple U.S. regions, the queue for new connections now stretches five to seven years. Capital that enters this sector without honestly underwriting permitting timelines will be waiting considerably longer than the investment thesis assumes.
As hyperscalers look to secure power, we are seeing unique partnerships emerge. For a closer look at the strategic moves behind this, check out: SpaceX-Google Deal & AI Infrastructure.
Sector 2: The GLP-1 Wave and Its Downstream Opportunity

GLP-1 drugs are the headline. The downstream investment opportunity – in telehealth, AI drug discovery, and combination therapeutics for a projected 30 million U.S. patients by 2030 – is what markets are still missing. Sources: J.P. Morgan Research; IQVIA Obesity Outlook 2026.
Eli Lilly crossing the $1 trillion market cap threshold made headlines. The more investable story sits below that number.
The U.S. patient base for GLP-1 receptor agonists is projected to reach 30 million users by 2030, according to IQVIA. The FDA approved the first oral GLP-1 drug in late 2025, with a second expected in April 2026 – removing the cold-chain logistics constraint that had kept these medications away from rural and developing markets entirely. J.P. Morgan Research projects the addressable market expanding sharply as Medicare coverage of obesity treatments now applies at scale.
Novo Nordisk, Pfizer – which acquired obesity biotech Metsera for approximately $10 billion – and a cohort of mid-cap challengers are competing on combination therapies, oral formats, and pipeline velocity. The AI drug discovery angle is where the asymmetric opportunity actually lives. Machine learning platforms now screen millions of molecular candidates in the time that previously required years of laboratory work. Recursion Pharmaceuticals and AbSci are compressing 10-year pipelines into three-year timelines – a valuation unlock that public markets are still calibrating.
Eli Lilly’s chief scientific officer Dan Skovronsky described the direction at the JPMorgan Healthcare Conference in January 2026: “The obesity market is going from a one-size-fits-all idea to different medicines for different patients.” That differentiation creates the competitive opportunity where mid-cap valuations will be set over the next three years, not at the large-cap level where Lilly and Novo trade.
The principal risk is binary and fast. FDA adverse rulings on late-stage trials can erase 40–60% of a mid-cap biotech’s market cap within 24 hours. Position sizing is not a portfolio management preference in this sector. It is the risk management strategy. There is no other way to participate in the asymmetry without absorbing the tail risk honestly.
For a broader perspective on current market trends and how to hedge against volatility, check out our full analysis: Gold vs. Silver: The 2026 Market Story Few Investors Are Watching.
Sector 3: Private Credit’s Quiet Dominance

Private credit has grown from $500 billion to $1.3 trillion in five years, with senior secured direct lending still yielding 9–12% in 2026. Moody’s projects the market exceeding $2 trillion in AUM this year. Sources: Moody’s Private Credit Outlook 2026; IMF Global Financial Stability Report 2025.
This is the least dramatic idea on the list. It is also the one with the most durable income profile.
The U.S. private credit market has grown from $500 billion to approximately $1.3 trillion over five years. Moody’s projects it will exceed $2 trillion in AUM in 2026 alone, approaching $4 trillion by 2030. The structural driver is not a rate cycle – it is the permanent retreat of bank balance sheets from middle-market lending following post-GFC regulatory requirements. Private credit filled that gap and has not relinquished it.
The 2026 opportunity set is expanding beyond the original thesis. McKinsey estimates that more than $620 billion in high-yield bonds and leveraged loans face maturity between 2026 and 2027 – a refinancing wave that will partially overflow into private credit channels at spreads that public markets cannot efficiently match. BlackRock, Ares, and Wellington are all prioritizing asset-based financing deployment. Direct lenders are still locking in yields of 9–12% on senior secured paper, a spread of 400–600 basis points above investment-grade public alternatives.
Business development companies provide publicly traded access to this asset class. Blue Owl and Ares Capital are the most cited names by institutional allocators. Opportunistic and distressed credit funds — over $100 billion raised in the past two years – are positioned for a default cycle that is already showing early stress signals. Asset-based finance across consumer loans and data infrastructure is the newest frontier, attracting institutional capital seeking yield with collateral backing.
The stress indicator that deserves full disclosure: the IMF’s 2025 Financial Stability Report found approximately 40% of private credit borrowers carrying negative free cash flow, up from 25% in 2021. This is not an immediate crisis. In a sustained high-rate environment, or under a macro shock that accelerates corporate stress, that number becomes a default driver faster than fund-level restructuring capacity can absorb. Manager selection and vintage year matter more in private credit than in almost any other asset class.
Sector 4: Cybersecurity – From Cost Center to Board Mandate
Ransomware was involved in 44% of all data breaches and 75% of system-intrusion incidents in 2024. The average U.S. data breach now costs approximately $10 million. At that figure, cyber insurance is no longer a line item that a CFO can reduce without a board explanation.
The global cyber insurance market reached $16.9 billion in 2025, with Munich Re and Allianz Commercial projecting expansion to $22–29 billion by 2027. S&P Global Ratings expects premium increases of 15–20% in 2026, citing AI-driven attack complexity and rising claim severity as the primary drivers. Hiscox data shows 57% of SMEs have experienced at least one attack tied to an AI-related vulnerability – a figure that is converting skeptical finance chiefs into buyers more efficiently than any vendor sales cycle.
The AI element runs in both directions. Threat actors are deploying machine learning to automate reconnaissance, personalize phishing campaigns at scale, and identify unpatched vulnerabilities before internal security teams can respond. Defense teams are deploying AI to match pace. The structure of that arms race – where neither side can achieve permanent advantage – creates durable demand for security products and insurance coverage simultaneously.
Zero-trust network architecture firms, specifically Zscaler and CrowdStrike, represent the infrastructure of AI-era enterprise security. Regulatory requirements are converting zero-trust from an optional investment into a compliance mandate across financial services and healthcare. Cyber-insurtech vendors combining real-time monitoring with underwriting are compressing loss ratios by knowing their clients’ risk profiles in real time. Managed Detection and Response platforms are the fastest-growing cybersecurity segment, as companies increasingly outsource the 24/7 threat hunting function they cannot realistically staff internally.
The product obsolescence risk is real and moves faster in this sector than almost anywhere else. Security vendors with significant exposure to older endpoint architectures face replacement cycles that can materialize within 18 to 24 months. Understanding a company’s product roadmap three years out – not just its current revenue – is essential diligence before any position is initiated.
Sector 5: Industrial Real Estate and the Reshoring Capital Commitment
The reshoring trend has been discussed for three years. The capital commitment making it investable is more recent and more concrete.
A 2025 survey of 500 U.S. companies found 45% citing proximity of manufacturing to engineering teams as a top reshoring priority, with freight cost reduction and geopolitical risk management completing the top three motivations. CBRE projects a 5% year-over-year increase in industrial leasing activity to nearly 1 billion square feet in 2026, with manufacturing now accounting for 20% of new leasing in Southeast and Central U.S. markets, up from 13% pre-pandemic.
The signed commitments are specific and large. The CHIPS Act provides $39 billion for domestic semiconductor manufacturing. Taiwan Semiconductor has committed $65 billion to U.S. operations. Intel’s pledge stands at $100 billion. These are not policy aspirations – they are contracted capital expenditures that produce multi-year demand for industrial real estate in the markets where the plants are being built.
Secondary markets – Greenville SC, Nashville, Cincinnati, Detroit, and Kansas City – are absorbing this capital at yield premiums to coastal gateway markets with comparable tenant credit quality. That premium is not a permanent discount. It is a window, and the geography of signed commitments makes the timing readable.
Alongside industrial CRE, franchise financing in essential services – logistics, auto-care, healthcare – generates structurally recession-resistant cash flows with yields of 10–14% for lenders with underwriting expertise. Banks remain constrained in small business lending by regulatory capital requirements, creating a private financing gap that is not closing quickly. Sale-leaseback transactions, where manufacturers monetize owned facilities to fund capital expenditure, are creating acquisition opportunities for investors seeking long-duration net-lease income.
The failure mode is geographic concentration. Reshoring capital is landing in specific submarkets, and secondary markets that do not receive initial commitments can stagnate for years. Submarket-level analysis – understanding which specific locations have signed commitments versus aspirational interest – is not supplementary research. It determines whether the thesis is valid in a given investment.
If you are looking for a clear starting point, read our core analysis: AI Investing Stock in 2026: What’s Actually Working?
What Could Break All Five Themes
Every investment thesis has a failure scenario. Here is an honest account of each.
AI infrastructure: If model efficiency improves faster than anticipated – reducing per-query energy consumption significantly – demand projections for data center capacity become overstated. Nuclear permitting timelines are also notoriously difficult to control, and a single regulatory reversal can delay projects by years with no compensation for committed capital.
GLP-1 downstream: A Phase 3 failure at a mid-cap biotech can destroy 50% of market cap within hours. Medicare and insurance coverage decisions for obesity treatments are subject to political pressure and can reverse faster than clinical pipelines can adapt.
Private credit: The IMF’s 40% negative free cash flow figure among borrowers is a stress indicator, not a present crisis. In a recession or a sustained high-rate environment, that figure becomes a default accelerant. Liquidity mismatches between fund terms and underlying loan duration remain a structural vulnerability that most private credit investors have not yet had to stress-test in a real downturn.
Cybersecurity: A catastrophic systemic infrastructure attack – the kind that produces claims well beyond actuarial models – could deteriorate insurance loss ratios faster than premium increases can compensate. On the product side, legacy endpoint security architectures face obsolescence timelines that are shortening as AI-driven attack methods evolve.
Industrial CRE and reshoring: Tariff policy can reverse as quickly as it escalated. A significant trade agreement or a change in legislative priority could reduce reshoring incentives materially. Secondary real estate markets are also less liquid than gateway cities, with localized stagnation risk for submarkets that miss the initial capital wave.
How Sophisticated Investors Think About Positioning Across These Sectors
The five sectors serve different portfolio functions and should not be sized identically.
Private credit and industrial CRE serve as the yield foundation – cash-flowing, collateral-backed, partially insulated from public market volatility. Their role is to generate durable income that does not depend on equity market direction in a given quarter.
AI infrastructure and cybersecurity serve as structural growth positions, sized to reflect the binary regulatory and technology risks within each. These are not unlimited-upside trades. They are long-duration structural themes with specific failure modes that must be incorporated into position sizing from the outset.
Mid-cap biotech with GLP-1 adjacency sits in a separate, smaller tactical allocation – high asymmetry, high volatility, requiring genuine willingness to hold through FDA-driven drawdowns without capitulating when the position looks worst.
The allocation between these buckets depends on time horizon, liquidity requirements, and volatility tolerance – not on the Fed’s next decision. The structural tailwinds in each sector persist across monetary policy scenarios. That durability is precisely what distinguishes these ideas from the rate-sensitive trades that dominate most 2026 investment commentary.
Sector Comparison: At a Glance
| Sector | Growth Potential | Income Potential | Risk Level | Investment Horizon | Suitable For |
|---|---|---|---|---|---|
| AI Infrastructure & Energy | High | Low–Medium | Medium–High | 3–7 years | Growth-oriented, long-duration investors |
| GLP-1 & Healthtech | Very High | Low | High | 2–5 years | Risk-tolerant with biotech familiarity |
| Private Credit | Medium | High (9–12%) | Medium | 3–5 years | Income-focused, institutional-grade access |
| Cybersecurity & Insurtech | High | Low–Medium | Medium | 3–5 years | Growth-oriented with technology exposure |
| Industrial CRE & Reshoring | Medium | High (10–14% franchise) | Medium | 5–10 years | Yield-seeking, real asset allocators |
Frequently Asked Questions
What are the best high-yield investment ideas for 2026?
Based on structural data through June 2026, five sectors offer the strongest risk-adjusted opportunity: AI infrastructure and energy, GLP-1 downstream investments, private credit, cybersecurity, and industrial real estate in reshoring markets. Each carries a different risk profile. Private credit offers the most durable income. Mid-cap biotech offers the highest potential asymmetry alongside the highest binary risk. None requires a specific Fed decision to maintain their structural tailwinds.
Why are private credit yields still at 9–12% when public bond yields are lower?
Private credit lenders extend capital to middle-market borrowers that public bond markets cannot efficiently serve. The yield premium reflects illiquidity, underwriting complexity, and the structural retreat of bank lending from this segment following post-GFC regulation. With the Fed holding rates elevated, the spread advantage over investment-grade public alternatives remains near historical highs according to Moody’s and Wellington Management research.
Is AI infrastructure still a credible investment opportunity in mid-2026?
The software and model provider stocks have priced in significant optimism. The less-crowded opportunity in 2026 sits in the enabling infrastructure – nuclear power, uranium supply, data center REITs, and cooling technology – that must grow to support AI demand regardless of which model or software company ultimately wins the competitive race. IEA projections suggest the underlying energy demand is structural and persists across AI market share scenarios.
What drove uranium prices above $100 per pound in early 2026?
Reactor demand is outpacing annual mine production at current capacity levels, creating a structural supply deficit. AI-linked nuclear development in the United States – including an $80 billion government agreement involving Westinghouse and Cameco – added explicit demand attribution to what was already a supply-constrained market. Uranium settled near $86 per pound after the January peak, still historically elevated versus the prior decade.
How risky is private credit compared to investment-grade bonds?
Private credit is meaningfully less liquid and involves lending to companies with higher default risk than investment-grade issuers. The IMF’s 2025 Financial Stability Report found approximately 40% of private credit borrowers carrying negative free cash flow. This is a genuine stress indicator. Private credit should function as a yield enhancer within a diversified portfolio, not a replacement for core fixed income. Manager selection and vintage year selection matter considerably.
Which U.S. markets offer the best industrial real estate exposure for reshoring?
CBRE and commercial real estate research consistently highlight Greenville SC, Nashville, Cincinnati, Detroit, and Kansas City as secondary markets absorbing the largest share of reshoring capital in 2026. These markets offer higher cap rates than coastal gateway markets while providing comparable tenant credit quality from signed manufacturing commitments including CHIPS Act recipients and major semiconductor producers.
What is the biggest single macro risk to all five themes simultaneously?
A severe U.S. recession accompanied by sharp credit tightening would stress all five themes concurrently – reducing AI capital expenditure budgets, accelerating private credit defaults, slowing GLP-1 adoption as discretionary healthcare spending contracts, reducing enterprise cyber budgets, and softening industrial leasing demand. A deep recession is the one scenario where the structural tailwinds in each sector are most likely to pause simultaneously.
What does the GLP-1 downstream investment opportunity actually mean?
It refers to companies that benefit from obesity drug adoption without being the primary manufacturers. This includes telehealth platforms scaling prescription infrastructure for tens of millions of future patients, AI drug discovery companies compressing clinical timelines, and mid-cap biotech developing next-generation combination therapies. J.P. Morgan Research and IQVIA projections suggest the addressable market expands significantly as Medicare coverage and oral drug formats broaden access.
Author’s Note
The analysis in this article draws on publicly available data from the Federal Reserve, International Energy Agency, Moody’s, McKinsey, J.P. Morgan Research, IQVIA, CBRE, Munich Re, the IMF, and Wellington Management, all cited in the Sources section below. Where projections are presented, they represent analyst estimates and institutional forecasts as of June 2026 – not guarantees of outcome. All investment theses described carry material risks, which are discussed explicitly within each sector section. VeritaLogic publishes independent financial analysis with no commercial relationship to any company, fund, or financial institution referenced herein.
The Practical Takeaway
The investors who looked back on 2024 with frustration were largely the ones who waited for consensus validation before acting on structural themes that were already visible in the data. The same pattern is repeating in 2026 – the most crowded corners of each sector have already priced the obvious thesis. The asymmetric entry points are in the second-order implications: the energy grid bottleneck behind AI, the downstream infrastructure behind GLP-1 adoption, the refinancing wave feeding into private credit, the geographic specificity of reshoring real estate demand.
None of these require the Fed to move. None require a specific election outcome. All of them require analytical work that consensus commentary has not done thoroughly.
That is where the best high-yield investment ideas for 2026 continue to reside – at the intersection of structural change, market inefficiency, and the willingness to do the research before the trade becomes obvious.
Sources
- Federal Reserve / FOMC – March 18, 2026 Summary of Economic Projections – federalreserve.gov
- Brookings Institution – Global Energy Demands Within the AI Regulatory Landscape, April 2026 – brookings.edu
- PR Newswire / Eagle Energy Metals – Uranium Demand Continues to Rise as AI Power Demand Rewrites the Nuclear Playbook, February 19, 2026 – prnewswire.com
- J.P. Morgan Research – How Supply and Demand for Weight Loss Drugs Is Playing Out in 2026 – jpmorgan.com
- IQVIA – Outlook for Obesity in 2026: From Consolidation to Acceleration – iqvia.com
- Moody’s – Private Credit Outlook 2026 Executive Summary, January 21, 2026 – moodys.com
- IQ-EQ – Private Credit Market Trends for 2026, February 3, 2026 – iqeq.com
- Wellington Management – Private Credit Outlook for 2026 – wellington.com
- IMF – Global Financial Stability Report 2025 – imf.org
- Munich Re – Cyber Insurance: Risks and Trends 2026 – munichre.com
- S&P Global / Swif – Cyber Insurance Statistics for 2026 – swif.ai
- TechTarget – RSAC 2026: Cyber Insurance and the Rise of Ransomware, April 8, 2026 – techtarget.com
- CBRE – U.S. Real Estate Market Outlook 2026 – Industrial – cbre.com
- PwC / ULI – Emerging Trends in Real Estate 2026 – Industrial – pwc.com
- McKinsey & Company – Private Markets Annual Review 2026 – mckinsey.com
Disclaimer
This article is published by VeritaLogic for educational and informational purposes only. Nothing herein constitutes personalized investment advice, a solicitation, or a recommendation to buy or sell any security or financial instrument.
All market data, economic projections, and sector statistics reflect publicly available information from named sources as of June 19, 2026. Forward-looking figures represent analyst estimates and institutional forecasts – not guaranteed outcomes. Market conditions can and do move against any structural thesis, including all five described in this article.
Private credit, biotechnology, and real estate investments carry additional risks including illiquidity, regulatory uncertainty, and capital loss that may not be appropriate for all investors. Past sector performance does not predict future returns.
VeritaLogic maintains no commercial relationship with any company, fund, or financial institution referenced herein. The author holds no position in any security mentioned in this article. Readers should conduct independent research and consult a qualified, licensed financial professional before making any investment decision.